

Understanding Workplace Dynamics through Organizational Network Analysis: A Demonstration using Game of Thrones Data
Introduction to ONA
Think about how work actually gets done. It’s not just about following the official company structure. People ask colleagues for advice, collaborate on projects across teams, and share information informally. These hidden connections are vital for getting things done, sparking new ideas, and building our company culture.
Organizational Network Analysis (ONA) is simply a tool to see and understand this hidden network. It helps us answer questions like:
- Who really talks to whom? Where does information flow quickly, and where does it get stuck?
- Who works well together? Are there teams or groups that are cut off from others?
- Who are the key “go-to” people? These might not be managers, but they are central to getting work done and influencing others.
- Are there hidden groups or cliques? ONA can show us natural working groups we didn’t know about.
ONA helps companies make informed decisions to boost productivity, support talent, manage change, and build a more equitable workplace. Since real employee data is sensitive, I used Game of Thrones (GOT) character interactions to demonstrate the method.
Mapping Connections Using Game of Thrones Data
The Data
I used data about who interacted with whom in Game of Thrones Season 6. (Data source: here). This includes:
- Characters (Nodes): A list of people (like our employees).
- Interactions (Edges): Records of which characters interacted, and how often (like emails, meetings, or working together). - The more interactions, the stronger the connection (Weight).
Packages used:
library(tidygraph)
library(ggraph)
library(igraph)
library(tidyverse)
library(kableExtra)
Loading the Data:
got_s6_edges <- read_csv("data/got-s6-edges.csv")

got_s6_nodes <- read_csv("data/got-s6-nodes.csv")
Quick Look at the Data:
glimpse(got_s6_edges)
Rows: 542
Columns: 4
$ Source <chr> "JON", "MISSANDEI", "TYRION", "ARYA", "DAVOS", "GREY_WORM", "DA…
$ Target <chr> "SANSA", "TYRION", "VARYS", "JAQEN", "MELISANDRE", "TYRION", "J…
$ Weight <dbl> 151, 88, 86, 83, 82, 81, 80, 80, 76, 76, 72, 69, 66, 64, 60, 57…
$ Season <dbl> 6, 6, 6, 6, 6, 6, 6, 6, 6, 6, 6, 6, 6, 6, 6, 6, 6, 6, 6, 6, 6, …
glimpse(got_s6_nodes)
Rows: 142
Columns: 2
$ Id    <chr> "AERON", "AERYS", "ALLISER_THORNE", "AREO", "ARTHUR", "ARTHUR_CH…
$ Label <chr> "Aeron", "Aerys", "Alliser", "Areo", "Arthur", "Arthur (child)",…
-
Interactions:
Source(who started),Target(who received),Weight(how strong),Season. -
Characters:
Id,Label(name).
This network has 142 characters (nodes) and 542 connections (edges).
Let’s see how much interaction happened overall:
| Total Interactions |
|---|
| 5795 |
There were 5795 weighted interactions – a lot of activity!
What To Look For in a Network
When looking at a network map, we want to focus on a few key things:
-
Groups (Communities): People often form groups that interact a lot internally, but less with outsiders. Think of departments, project teams, or even lunch groups. Finding these helps us see natural working units and potential barriers between groups (“silos”).
-
Important People (Centrality): Some people are more important in the network than others. We measure this in a few ways:
-
Most Connected (Degree): Who has the most direct connections? These people are local hubs of activity.
-
Key Connectors (Betweenness): Who sits between different groups and connects people who wouldn’t otherwise be connected? These are vital bridges for information flow. Losing them can break the network apart. They can also become bottlenecks if they’re too busy.
-
Influencers (PageRank): Who is connected to other well-connected people? These individuals often have broad influence and access to information across the network.
Finding these Patterns: We can calculate these scores for everyone in the network.
What The Map Showed
The Big Picture
Let’s draw the map to see the overall structure.
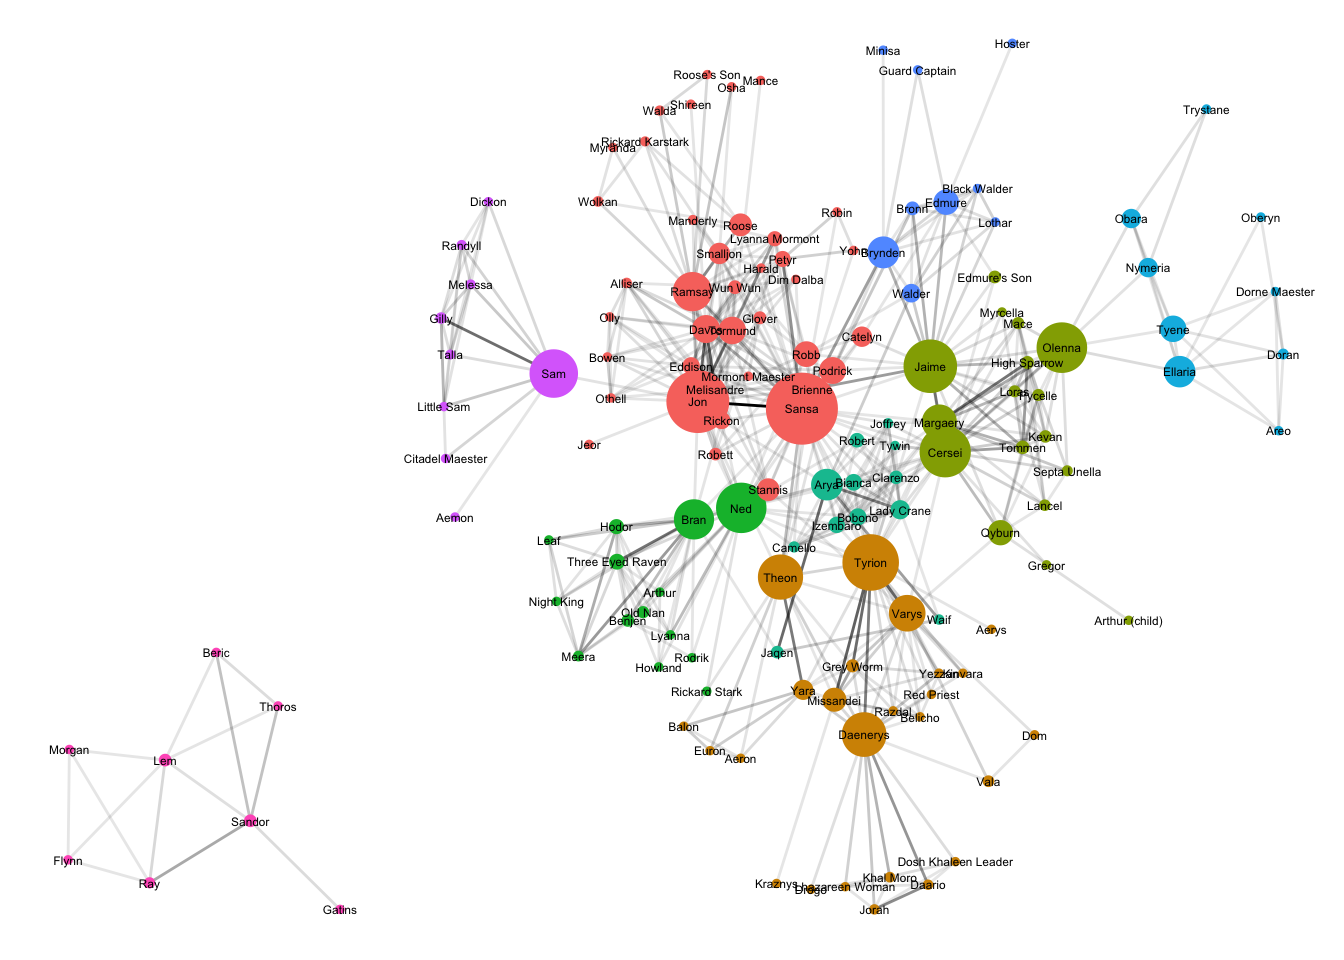
What this Map Shows:
-
Groups (Colors): The different colors show distinct groups. Do these match our departments? Are some groups isolated with few links to others (silos)?
-
Key Connectors (Big Dots): People like Sansa, Daenerys, Tyrion are big dots – they connect different groups. In our company, who are these vital bridges? We need to support them, but also ensure they aren’t bottlenecks.
-
Strong Relationships (Thick Lines): Thick lines show frequent interaction. Are the right people talking? Are there weak links where we expect strong ones?
-
Influencers (Big Labels): Characters with bigger labels are connected to other important people. In our workplace, these could be leaders, experts, or trusted advisors.
Who’s Important in Each Group?
Let’s find the most directly connected person (highest “Degree” score) within each colored group.
[1] "Most Connected Person (by Direct Ties) in each Group:"

[1] "Sansa"    "Daenerys" "Cersei"   "Tyrion"   "Ned"      "Brynden"  "Ellaria"
[8] "Sam"      "Lem"
The analysis picks out key figures in different storylines: Sansa (North), Daenerys (Essos), Cersei (King’s Landing), etc. These are the main hubs within their circles.
What This Means: Finding the most connected person in each team or department helps me identify:
-
Local Leaders: Maybe the official manager, or maybe just the informal go-to person in that group.
-
Information Hubs: They likely know what’s going on within their group.
-
Good Representatives: They might be good people to ask for the group’s opinion.
Map Highlighting the Key People in Each Group
Let’s redraw the map, but only label these key group figures.
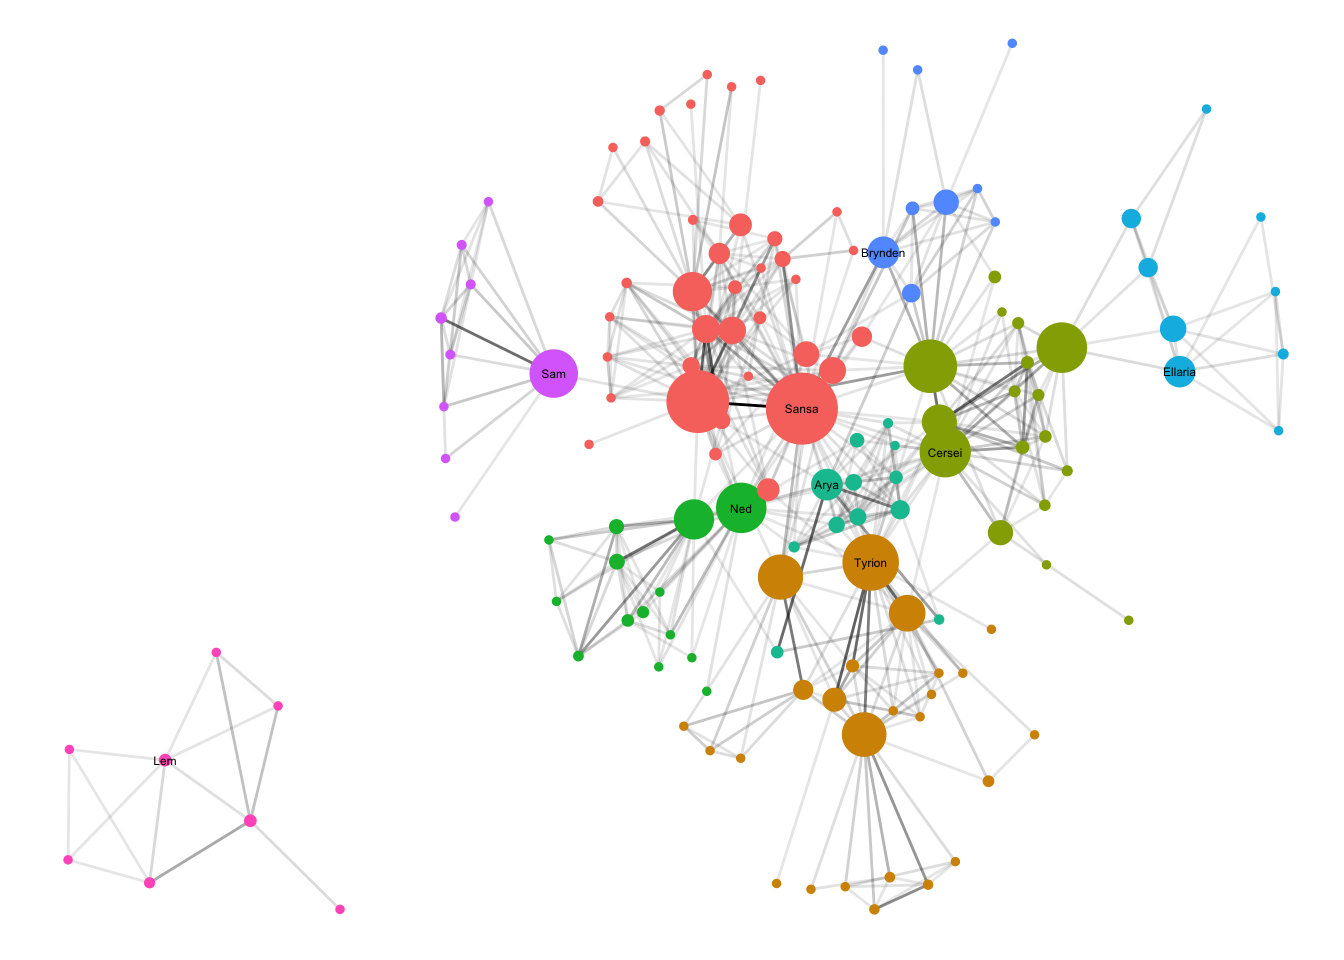
What This Shows:
This map makes it easier to see how the main hubs of different teams or groups are connected (or not connected) to each other. It highlights potential cross-team leaders or critical links between departments.
ONA & DEIA: Key Implications
Looking at network maps like the Game of Thrones example can give organizations powerful insights into fairness and inclusion within their workplace. Here’s how ONA can help a company understand and improve Diversity, Equity, Inclusion, and Accessibility (DEIA):
-
Finding Hidden Diverse Influencers: ONA can reveal influential people and key connectors who belong to underrepresented groups but might not hold senior titles. Are these individuals recognized within the organization? Are they receiving adequate support? Identifying them helps ensure diverse voices contribute to decision-making and can highlight pathways for creating fairer opportunities for growth.
-
Checking for Fair Access to Information: Does important information reach everyone equitably, or are some demographic groups systematically excluded? ONA can map whether people from underrepresented backgrounds are consistently outside the main information flows, potentially missing out on opportunities or feeling isolated. This helps identify and address communication barriers.
-
Seeing if Teams are Truly Inclusive: ONA can illustrate whether work groups and teams integrate people from different backgrounds, or if individuals tend to cluster with others similar to themselves (homophily). It helps visualize if employees from underrepresented groups are central to team networks or are positioned on the periphery.
-
Understanding the Impact When Diverse Talent Leaves: If a key connector from an underrepresented group departs, who else within the network loses connections? ONA can show if their departure disproportionately isolates others from similar backgrounds, highlighting the need for stronger retention strategies, supportive networks, and broader relationship-building initiatives for everyone.
-
Making Onboarding Fair for Everyone: Are new hires from diverse backgrounds integrating into the organizational network as quickly and effectively as others? ONA can track this integration process. If certain groups consistently take longer to build connections, it may signal biases or areas where onboarding processes need to be made more intentionally inclusive.
-
Including Diverse Voices in Decisions & Change: When planning organizational changes, are perspectives gathered equitably? ONA helps identify trusted influencers across various employee groups. Engaging these diverse influencers can lead to change initiatives that are more effective, sustainable, and perceived as fairer by the workforce.
-
Spotting Hidden Barriers: The informal network revealed by ONA might uncover systemic inequities hidden by the formal organizational chart. For instance, ONA might show that opportunities to join high-profile projects are disproportionately allocated to certain demographic groups. This data provides a basis for examining and addressing practices to create more equitable opportunities.
By utilizing ONA with a focus on DEIA, organizations can move beyond assumptions and gather objective data about inclusion, helping to build workplaces where everyone feels connected, valued, and has equitable opportunities to succeed.
Recommendations for Organizations
Companies can use ONA insights to improve effectiveness and DEIA:
-
Conduct ONA Ethically: Periodically map networks (via surveys or anonymized data with strict privacy controls) to track dynamics.
-
Support Diverse Connectors: Recognize, support, and develop influential employees from underrepresented groups.
-
Bridge Gaps: Actively foster connections between isolated groups or individuals, especially across demographic lines.
-
Mitigate Key Person Risk: Plan for succession and knowledge sharing, particularly for diverse individuals in critical bridging roles.
-
Integrate ONA into DEIA Strategy: Use network data to inform initiatives and measure progress on inclusion goals.
Project Limitations to Note
- Example Data: In this project, I used Game of Thrones data as a substitute for real workplace data. While illustrative, character interactions in a fictional series are driven by different factors than professional interactions in an organization.
- Data Collection Challenges: Implementing ONA in a real organization requires careful planning around data collection methods (surveys, passive data), ensuring data quality, and navigating ethical considerations and privacy regulations.
- Static Snapshot: The analysis presented here represents a single point in time (Season 6). Real organizational networks are dynamic and change constantly. ONA provides the most value when used to track trends over time.
Conclusion
Organizational Network Analysis offers a valuable method for looking beyond formal structures to understand the real, informal networks that drive communication, collaboration, and influence within a company. As I demonstrated using the Game of Thrones dataset, ONA techniques can identify key structures, influencers, and potential bottlenecks.
When viewed through a DEIA lens, ONA can provide objective data to help organizations build more equitable, inclusive, and ultimately more effective workplaces by ensuring everyone is connected and valued.